Lecture 3: Data Analysis
Contents
Lecture 3: Data Analysis
Warning
This page is still building. Please be patient for the coming lectures.
In this lecture, we will learn data analysis as well as presentation in Python including follwoing four packages:

Fig. 15 The “Four Musketeers” for Python data analysis: numPy, matplotlib,
pandas and seaborn.
Why you need Python data analysis
Basically, modern office suite like Microsoft Excel provides powerful features
to process and present your data. However, they are lacking of flexibility and
the features are hidden in their complex UI (user interface). On the other hand,
Python gives us more efficient and flexible way to operate data. For example,
Microsoft Excel has a maximum row number \(1048576=2^{20}\) in Office 2007
or later while pandas can easily exceed this limitation.
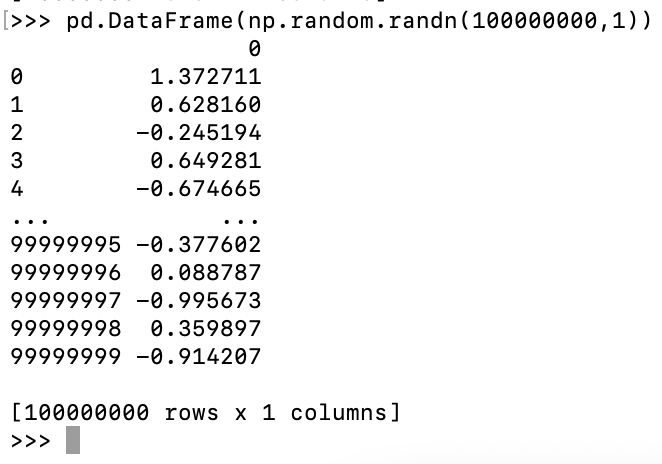
Fig. 16 A table has 100,000,000 rows x 1 columns.
It is also possible to custom a pipeline with help of these packages so you can analyze data automatically. Once you build one, you can just run it every time when you have new data rather than operating data again and again.
Preparation
Warning
This is an advanced lecture so it is recommended to learn lecture 1 and lecture 2 before it if you have no background in Python programming.
Pandas is a data analysis and manipulation tools based on Python. To learn Pandas, the best material is the official cookbook which can be found at the official website. The documentation for pandas is also helpful for your learning.
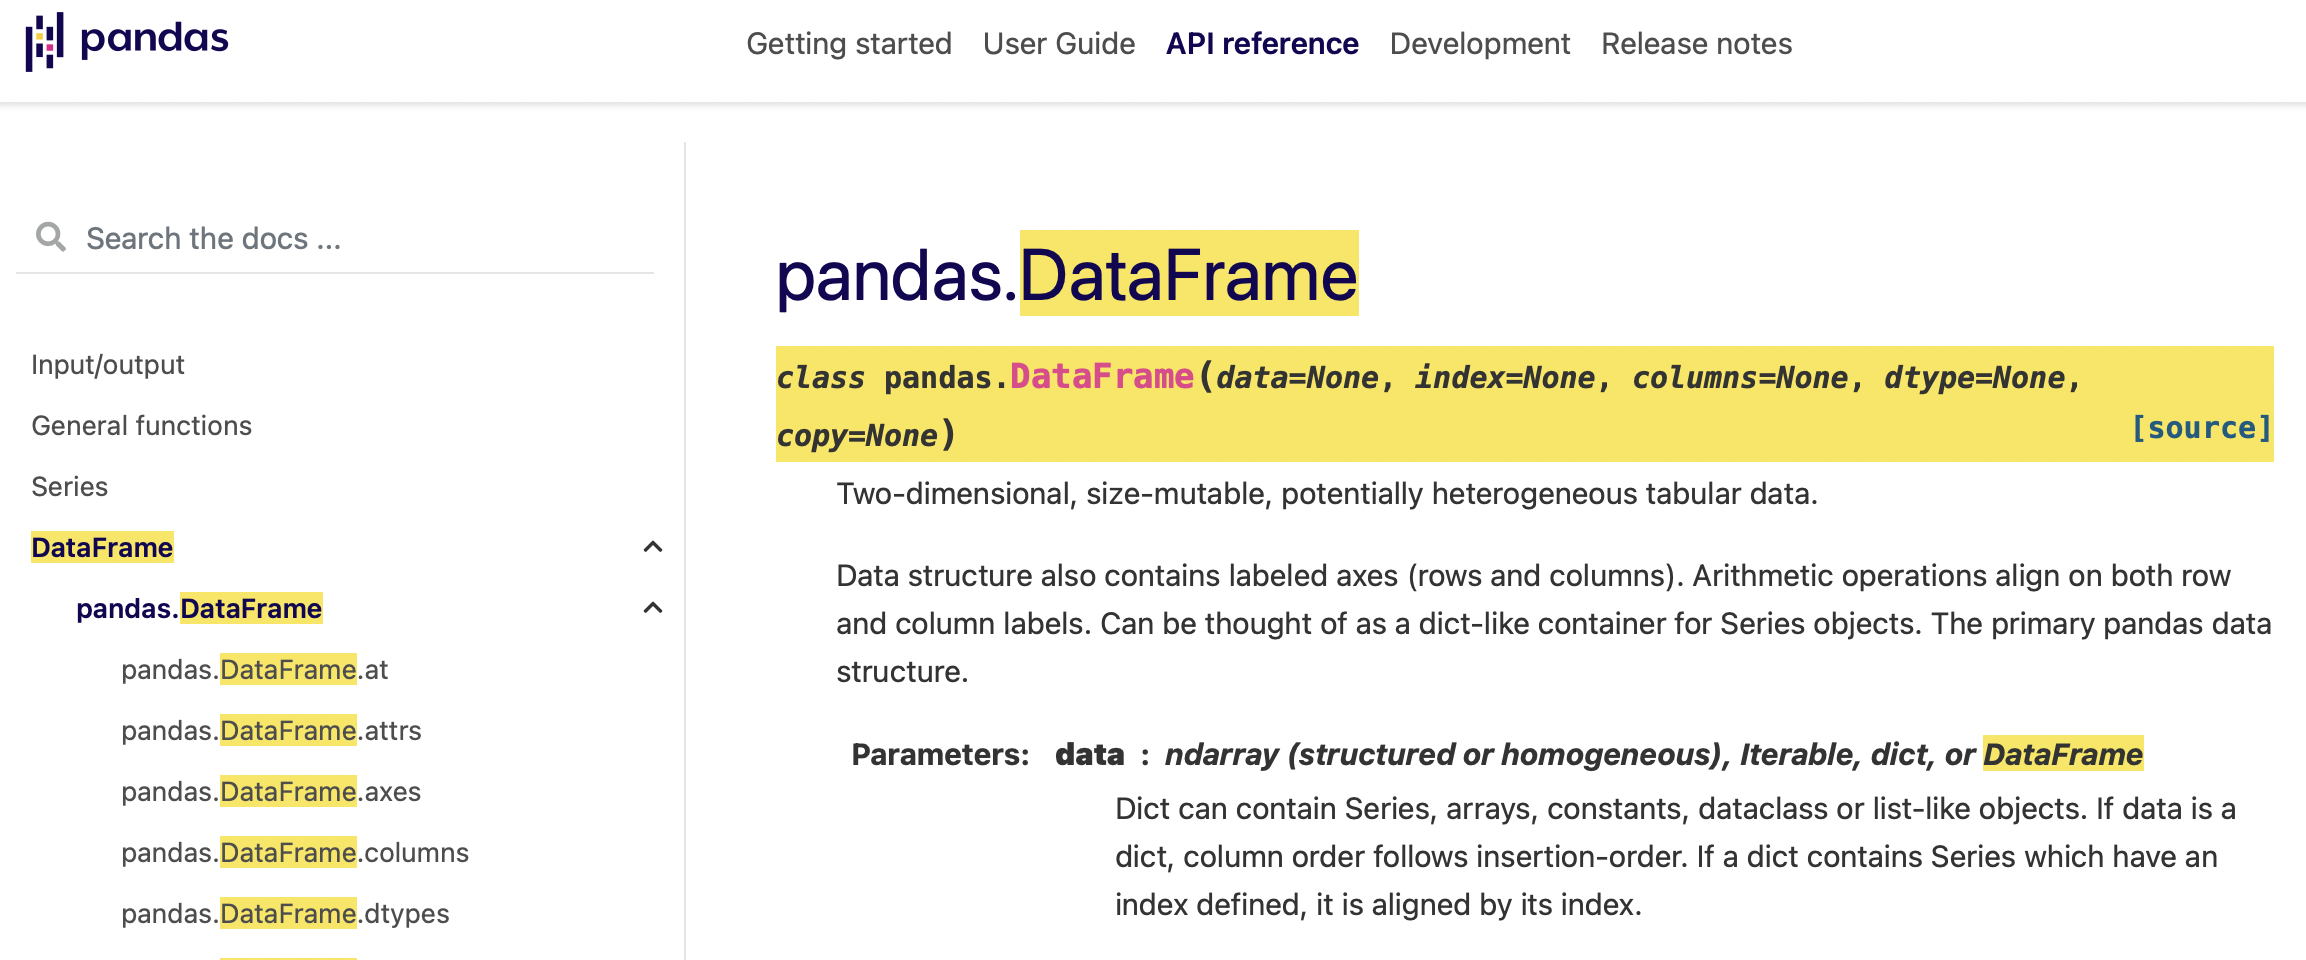
Fig. 17 A sample entry of pandas docs. DataFrame is the basic data container in pandas.
Before start everything, we need to install Pandas as well as some other packages via pip.
numPy:pandasis based onnumPy, an efficient numerical computation package written in C++.openpyxl:pandasrequires it to read data from excel file.matplotlib: a graphical package to draw figures.
!pip install -q pandas numpy openpyxl matplotlib
Note
Here
-qmeans quiet installation which can be ignored if you don not understand.In Jupyter Notebook, command starting with mark
!is NOT native Python code, but a wrapped shell command, i.e. you can runpip install numpyto installnumPyin your Anaconda Prompt Shell.
Let us import these two packages with short names:
import numpy as np
import pandas as pd
Data container
Pandas provides two types of container Series and DataFrame which are used to store sequential
and tabular data respectively.

Fig. 18 Series storing sequential data.

Fig. 19 DataFrame storing tabular data.
Run following code to create two data containers.
s = pd.Series([1,2,3,4,5,6])
d = pd.DataFrame(np.arange(1, 19).reshape(3, -1))

print(s)
print(d)
0    1
1    2
2    3
3    4
4    5
5    6
dtype: int64
    0   1   2   3   4   5
0   1   2   3   4   5   6
1   7   8   9  10  11  12
2  13  14  15  16  17  18
Note
Here np.arange(1, 19) will generate a arrary from \(1\) to \(18\), and reshape(3, -1)
will change the shape of arrary with first dimension as \(3\). Parameter -1 means it will be
derivated internally and here will be replaced with \(6\) because \(6=18\div 3\).
shape is a property of container and it is a tuple of dimensions.
print(s.shape)
print(d.shape)
(6,)
(3, 6)
For very large DataFrame, Jupyter notebook will only show a part of the content:
d = pd.DataFrame(np.random.randn(100, 30))
d
| 0 | 1 | 2 | 3 | 4 | 5 | 6 | 7 | 8 | 9 | ... | 20 | 21 | 22 | 23 | 24 | 25 | 26 | 27 | 28 | 29 | |
|---|---|---|---|---|---|---|---|---|---|---|---|---|---|---|---|---|---|---|---|---|---|
| 0 | -0.343684 | 0.298432 | -0.346330 | -1.360610 | -0.780171 | -0.174479 | -2.073209 | 0.741540 | 0.862682 | 1.790920 | ... | 1.427133 | -0.330105 | -0.833102 | -1.314724 | 0.896119 | -0.738813 | 1.374135 | 0.440371 | 1.041022 | -0.121798 |
| 1 | -0.193280 | 1.257865 | 0.658521 | -0.556523 | 0.867679 | 1.392618 | 1.358895 | 1.235232 | 0.598424 | 0.407585 | ... | 0.480264 | 0.024192 | 0.416871 | 0.503437 | -1.003764 | -0.444086 | -1.318141 | -0.002651 | 0.091065 | 0.267475 |
| 2 | -0.091231 | 1.268993 | 0.825904 | -0.386833 | 0.215122 | 0.575687 | -1.589176 | 1.526072 | -1.083706 | 0.360741 | ... | -0.404119 | 0.178404 | -0.065295 | 0.571753 | -1.697193 | 1.665987 | -0.487148 | 0.983719 | 1.474843 | 1.010711 |
| 3 | -1.040651 | 0.876857 | 0.090111 | -0.774266 | 0.412296 | 0.903602 | 0.168427 | -0.690537 | 0.620906 | 0.483258 | ... | -0.225915 | 0.139047 | 0.568339 | -0.726861 | -0.061449 | 1.187309 | 1.819904 | 0.746932 | 0.246057 | -0.622705 |
| 4 | -0.890623 | -1.924294 | -1.607911 | -0.919474 | -0.756320 | -0.130709 | 0.181522 | 0.337458 | 0.750356 | -0.552621 | ... | -1.348002 | 0.687834 | -0.597506 | -0.185708 | 0.681879 | -1.264852 | -1.432979 | -0.262975 | 0.340943 | 1.115939 |
| ... | ... | ... | ... | ... | ... | ... | ... | ... | ... | ... | ... | ... | ... | ... | ... | ... | ... | ... | ... | ... | ... |
| 95 | -0.790644 | 0.618316 | -0.239128 | 0.223507 | -1.972358 | 1.344895 | -0.921793 | 1.239987 | -0.727588 | 2.143194 | ... | 0.173822 | -0.209904 | 0.167663 | 1.023742 | -1.487167 | -0.950625 | -0.448279 | -0.726560 | 1.566739 | -2.048781 |
| 96 | -0.897666 | -1.011664 | -1.305373 | 0.292486 | 0.033395 | 1.184037 | -0.224618 | -0.603053 | 0.583313 | 1.238475 | ... | -1.162605 | 1.927186 | 0.189962 | -0.048620 | -0.499449 | -1.396445 | -0.187596 | -0.866826 | 0.488415 | -1.043417 |
| 97 | -0.386214 | -0.737502 | -0.724941 | 2.207187 | 1.191978 | -0.849805 | 1.267080 | 0.092453 | 0.524919 | -0.903533 | ... | -1.127624 | 0.242240 | 0.553355 | -1.119842 | 0.132852 | -1.981549 | 1.617266 | -1.088464 | -1.790250 | 0.687706 |
| 98 | 0.256366 | -1.496072 | -0.901937 | -0.612122 | -0.097003 | -0.011705 | 0.593026 | -0.146939 | -0.992527 | -0.885829 | ... | 1.609611 | 1.205030 | -0.915260 | 0.181878 | 0.419530 | 2.393224 | 0.259172 | 0.533195 | 0.432964 | 0.874746 |
| 99 | -0.000901 | -1.145946 | 0.295250 | -0.390829 | 1.592131 | 0.339830 | 1.496009 | -0.121397 | 0.382855 | -0.491859 | ... | -1.915573 | -0.667241 | 1.049157 | 0.382023 | -0.689314 | 0.989662 | 0.171298 | -0.197036 | -0.235648 | 0.647312 |
100 rows × 30 columns
Note
Here np.random.randn(n, m) will generate a random matrix with \(n\) rows and \(m\) columns.
Each element in the matrix follows the standard normal distribution
\( X\sim \frac{1}{\sqrt{2\pi}}e^{-\frac{x^2}{2}}\)
Try head(n) and it will give you the first \(n\) rows of the DataFrame while tail(n)
will give the last \(n\) rows.
d.head(5)
| 0 | 1 | 2 | 3 | 4 | 5 | 6 | 7 | 8 | 9 | ... | 20 | 21 | 22 | 23 | 24 | 25 | 26 | 27 | 28 | 29 | |
|---|---|---|---|---|---|---|---|---|---|---|---|---|---|---|---|---|---|---|---|---|---|
| 0 | -0.343684 | 0.298432 | -0.346330 | -1.360610 | -0.780171 | -0.174479 | -2.073209 | 0.741540 | 0.862682 | 1.790920 | ... | 1.427133 | -0.330105 | -0.833102 | -1.314724 | 0.896119 | -0.738813 | 1.374135 | 0.440371 | 1.041022 | -0.121798 |
| 1 | -0.193280 | 1.257865 | 0.658521 | -0.556523 | 0.867679 | 1.392618 | 1.358895 | 1.235232 | 0.598424 | 0.407585 | ... | 0.480264 | 0.024192 | 0.416871 | 0.503437 | -1.003764 | -0.444086 | -1.318141 | -0.002651 | 0.091065 | 0.267475 |
| 2 | -0.091231 | 1.268993 | 0.825904 | -0.386833 | 0.215122 | 0.575687 | -1.589176 | 1.526072 | -1.083706 | 0.360741 | ... | -0.404119 | 0.178404 | -0.065295 | 0.571753 | -1.697193 | 1.665987 | -0.487148 | 0.983719 | 1.474843 | 1.010711 |
| 3 | -1.040651 | 0.876857 | 0.090111 | -0.774266 | 0.412296 | 0.903602 | 0.168427 | -0.690537 | 0.620906 | 0.483258 | ... | -0.225915 | 0.139047 | 0.568339 | -0.726861 | -0.061449 | 1.187309 | 1.819904 | 0.746932 | 0.246057 | -0.622705 |
| 4 | -0.890623 | -1.924294 | -1.607911 | -0.919474 | -0.756320 | -0.130709 | 0.181522 | 0.337458 | 0.750356 | -0.552621 | ... | -1.348002 | 0.687834 | -0.597506 | -0.185708 | 0.681879 | -1.264852 | -1.432979 | -0.262975 | 0.340943 | 1.115939 |
5 rows × 30 columns
In order to make our examples meaningful,
we employ a real-world dataset as an example to show how pandas works. World Health Organization
provides latest data about the COVID-19 such as vaccination and confirmed cases, which is keeped in CSV-format files. Here we
refer to the vaccination data: https://covid19.who.int/who-data/vaccination-data.csv.
vac = pd.read_csv('https://covid19.who.int/who-data/vaccination-data.csv')
vac
| COUNTRY | ISO3 | WHO_REGION | DATA_SOURCE | DATE_UPDATED | TOTAL_VACCINATIONS | PERSONS_VACCINATED_1PLUS_DOSE | TOTAL_VACCINATIONS_PER100 | PERSONS_VACCINATED_1PLUS_DOSE_PER100 | PERSONS_FULLY_VACCINATED | PERSONS_FULLY_VACCINATED_PER100 | VACCINES_USED | FIRST_VACCINE_DATE | NUMBER_VACCINES_TYPES_USED | |
|---|---|---|---|---|---|---|---|---|---|---|---|---|---|---|
| 0 | Afghanistan | AFG | EMRO | REPORTING | 2022-03-06 | 5597130 | 4952744.0 | 14.378 | 12.723 | 4281934.0 | 11.000 | Beijing CNBG - BBIBP-CorV,Janssen - Ad26.COV 2... | 2021-02-22 | 4.0 |
| 1 | Albania | ALB | EURO | REPORTING | 2022-02-20 | 2707658 | 1284034.0 | 94.100 | 45.118 | 1192155.0 | 41.889 | AstraZeneca - Vaxzevria,Gamaleya - Gam-Covid-V... | 2021-01-13 | 5.0 |
| 2 | Algeria | DZA | AFRO | REPORTING | 2022-02-20 | 13631683 | 7456361.0 | 31.086 | 17.004 | 6076272.0 | 13.857 | Beijing CNBG - BBIBP-CorV,Gamaleya - Gam-Covid... | 2021-01-30 | 4.0 |
| 3 | American Samoa | ASM | WPRO | REPORTING | 2022-02-16 | 85050 | 42212.0 | 154.084 | 76.475 | 37805.0 | 68.491 | Janssen - Ad26.COV 2-S,Moderna - Spikevax,Pfiz... | 2020-12-21 | 3.0 |
| 4 | Andorra | AND | EURO | REPORTING | 2022-02-13 | 142420 | 57797.0 | 184.300 | 75.872 | 53250.0 | 69.903 | AstraZeneca - Vaxzevria,Moderna - Spikevax,Pfi... | 2021-01-20 | 3.0 |
| ... | ... | ... | ... | ... | ... | ... | ... | ... | ... | ... | ... | ... | ... | ... |
| 223 | Viet Nam | VNM | WPRO | REPORTING | 2022-02-24 | 192865986 | 79469390.0 | 198.139 | 81.642 | 75322542.0 | 77.382 | AstraZeneca - Vaxzevria,Beijing CNBG - BBIBP-C... | 2021-03-08 | 6.0 |
| 224 | Wallis and Futuna | WLF | WPRO | REPORTING | 2022-02-18 | 15633 | 6450.0 | 139.009 | 57.354 | 6399.0 | 56.900 | Moderna - Spikevax | 2021-03-19 | 1.0 |
| 225 | Yemen | YEM | EMRO | REPORTING | 2022-03-06 | 784792 | 624837.0 | 2.631 | 2.095 | 384655.0 | 1.290 | Janssen - Ad26.COV 2-S,SII - Covishield,Sinova... | 2021-04-20 | 3.0 |
| 226 | Zambia | ZMB | AFRO | REPORTING | 2022-03-03 | 2858338 | 2510296.0 | 15.548 | 13.655 | 1883799.0 | 10.247 | Beijing CNBG - BBIBP-CorV,Janssen - Ad26.COV 2... | 2021-04-14 | 3.0 |
| 227 | Zimbabwe | ZWE | AFRO | REPORTING | 2022-03-04 | 7904719 | 4368633.0 | 53.184 | 29.393 | 3403501.0 | 22.899 | Beijing CNBG - BBIBP-CorV,Bharat - Covaxin,Gam... | 2021-02-18 | 4.0 |
228 rows × 14 columns
Note
read_csv(path) reads a CSV-format file from URL (Web link or local file) and returns a DataFrame.
For example, you can use pd.read_csv('./data.csv') to load csv file from your current directory.
Properties index and columns will give the row/column labels:
vac.columns
Index(['COUNTRY', 'ISO3', 'WHO_REGION', 'DATA_SOURCE', 'DATE_UPDATED',
       'TOTAL_VACCINATIONS', 'PERSONS_VACCINATED_1PLUS_DOSE',
       'TOTAL_VACCINATIONS_PER100', 'PERSONS_VACCINATED_1PLUS_DOSE_PER100',
       'PERSONS_FULLY_VACCINATED', 'PERSONS_FULLY_VACCINATED_PER100',
       'VACCINES_USED', 'FIRST_VACCINE_DATE', 'NUMBER_VACCINES_TYPES_USED'],
      dtype='object')
In addition, you may want to sort by values, just like what we usually do in Excel.
vac.sort_values(by='TOTAL_VACCINATIONS', ascending=False)
| COUNTRY | ISO3 | WHO_REGION | DATA_SOURCE | DATE_UPDATED | TOTAL_VACCINATIONS | PERSONS_VACCINATED_1PLUS_DOSE | TOTAL_VACCINATIONS_PER100 | PERSONS_VACCINATED_1PLUS_DOSE_PER100 | PERSONS_FULLY_VACCINATED | PERSONS_FULLY_VACCINATED_PER100 | VACCINES_USED | FIRST_VACCINE_DATE | NUMBER_VACCINES_TYPES_USED | |
|---|---|---|---|---|---|---|---|---|---|---|---|---|---|---|
| 43 | China | CHN | WPRO | REPORTING | 2022-02-27 | 3138003103 | 1.276556e+09 | 213.283 | 86.765 | 1.235633e+09 | 83.983 | Anhui ZL - Recombinant,Beijing CNBG - BBIBP-Co... | 2020-07-22 | 8.0 |
| 94 | India | IND | SEARO | REPORTING | 2022-02-28 | 1776718549 | 9.642345e+08 | 128.747 | 69.872 | 7.923996e+08 | 57.420 | Bharat - Covaxin,Gamaleya - Gam-Covid-Vac,Jans... | 2021-01-16 | 6.0 |
| 218 | United States of America | USA | AMRO | REPORTING | 2022-02-25 | 537567013 | 2.531571e+08 | 162.406 | 76.482 | 2.101726e+08 | 63.496 | Janssen - Ad26.COV 2-S,Moderna - Spikevax,Pfiz... | 2020-12-14 | 3.0 |
| 29 | Brazil | BRA | AMRO | REPORTING | 2022-02-25 | 369527744 | 1.723341e+08 | 173.847 | 81.076 | 1.487775e+08 | 69.993 | AstraZeneca - Vaxzevria,Janssen - Ad26.COV 2-S... | 2021-01-17 | 5.0 |
| 95 | Indonesia | IDN | SEARO | REPORTING | 2022-03-01 | 345697245 | 1.909768e+08 | 126.387 | 69.821 | 1.445058e+08 | 52.831 | AstraZeneca - Vaxzevria,Beijing CNBG - BBIBP-C... | 2021-01-13 | 7.0 |
| ... | ... | ... | ... | ... | ... | ... | ... | ... | ... | ... | ... | ... | ... | ... |
| 172 | Saba | XCA | AMRO | REPORTING | 2022-02-25 | 3148 | 1.582000e+03 | 162.856 | 81.842 | 1.566000e+03 | 81.014 | NaN | NaN | NaN |
| 186 | Sint Eustatius | XBA | AMRO | REPORTING | 2022-02-25 | 3110 | 1.588000e+03 | 99.076 | 50.589 | 1.522000e+03 | 48.487 | NaN | NaN | NaN |
| 149 | Niue | NIU | WPRO | REPORTING | 2021-11-24 | 2628 | 1.340000e+03 | 162.423 | 82.818 | 1.288000e+03 | 79.604 | Pfizer BioNTech - Comirnaty | 2021-06-08 | 1.0 |
| 206 | Tokelau | TKL | WPRO | REPORTING | 2021-09-28 | 1936 | 9.680000e+02 | 143.407 | 71.704 | 9.680000e+02 | 71.704 | Pfizer BioNTech - Comirnaty | 2021-07-20 | 1.0 |
| 162 | Pitcairn Islands | PCN | WPRO | REPORTING | 2021-11-11 | 74 | 3.700000e+01 | 148.000 | 74.000 | 3.700000e+01 | 74.000 | AstraZeneca - Vaxzevria | 2021-05-17 | 1.0 |
228 rows × 14 columns
T property will return a transpose of DataFrame.
vac.T
| 0 | 1 | 2 | 3 | 4 | 5 | 6 | 7 | 8 | 9 | ... | 218 | 219 | 220 | 221 | 222 | 223 | 224 | 225 | 226 | 227 | |
|---|---|---|---|---|---|---|---|---|---|---|---|---|---|---|---|---|---|---|---|---|---|
| COUNTRY | Afghanistan | Albania | Algeria | American Samoa | Andorra | Angola | Anguilla | Antigua and Barbuda | Argentina | Armenia | ... | United States of America | Uruguay | Uzbekistan | Vanuatu | Venezuela (Bolivarian Republic of) | Viet Nam | Wallis and Futuna | Yemen | Zambia | Zimbabwe |
| ISO3 | AFG | ALB | DZA | ASM | AND | AGO | AIA | ATG | ARG | ARM | ... | USA | URY | UZB | VUT | VEN | VNM | WLF | YEM | ZMB | ZWE |
| WHO_REGION | EMRO | EURO | AFRO | WPRO | EURO | AFRO | AMRO | AMRO | AMRO | EURO | ... | AMRO | AMRO | EURO | WPRO | AMRO | WPRO | WPRO | EMRO | AFRO | AFRO |
| DATA_SOURCE | REPORTING | REPORTING | REPORTING | REPORTING | REPORTING | REPORTING | REPORTING | REPORTING | REPORTING | REPORTING | ... | REPORTING | REPORTING | REPORTING | REPORTING | REPORTING | REPORTING | REPORTING | REPORTING | REPORTING | REPORTING |
| DATE_UPDATED | 2022-03-06 | 2022-02-20 | 2022-02-20 | 2022-02-16 | 2022-02-13 | 2022-03-02 | 2022-02-25 | 2022-02-25 | 2022-02-25 | 2022-02-13 | ... | 2022-02-25 | 2022-02-25 | 2022-02-20 | 2022-02-20 | 2022-02-25 | 2022-02-24 | 2022-02-18 | 2022-03-06 | 2022-03-03 | 2022-03-04 |
| TOTAL_VACCINATIONS | 5597130 | 2707658 | 13631683 | 85050 | 142420 | 16633167 | 22165 | 124726 | 93008081 | 1971565 | ... | 537567013 | 7612199 | 42121870 | 197335 | 37860994 | 192865986 | 15633 | 784792 | 2858338 | 7904719 |
| PERSONS_VACCINATED_1PLUS_DOSE | 4952744.0 | 1284034.0 | 7456361.0 | 42212.0 | 57797.0 | 10780927.0 | 10370.0 | 63582.0 | 40572052.0 | 1080404.0 | ... | 253157102.0 | 2964083.0 | 18446210.0 | 114284.0 | 22157232.0 | 79469390.0 | 6450.0 | 624837.0 | 2510296.0 | 4368633.0 |
| TOTAL_VACCINATIONS_PER100 | 14.378 | 94.1 | 31.086 | 154.084 | 184.3 | 50.609 | 147.747 | 127.364 | 205.789 | 66.5 | ... | 162.406 | 219.136 | 125.9 | 64.248 | 133.145 | 198.139 | 139.009 | 2.631 | 15.548 | 53.184 |
| PERSONS_VACCINATED_1PLUS_DOSE_PER100 | 12.723 | 45.118 | 17.004 | 76.475 | 75.872 | 32.802 | 69.124 | 64.927 | 89.77 | 36.46 | ... | 76.482 | 85.329 | 55.114 | 37.208 | 77.92 | 81.642 | 57.354 | 2.095 | 13.655 | 29.393 |
| PERSONS_FULLY_VACCINATED | 4281934.0 | 1192155.0 | 6076272.0 | 37805.0 | 53250.0 | 5609044.0 | 9531.0 | 61144.0 | 36237826.0 | 872336.0 | ... | 210172612.0 | 2728709.0 | 13160671.0 | 85180.0 | 14287370.0 | 75322542.0 | 6399.0 | 384655.0 | 1883799.0 | 3403501.0 |
| PERSONS_FULLY_VACCINATED_PER100 | 11.0 | 41.889 | 13.857 | 68.491 | 69.903 | 17.066 | 63.532 | 62.437 | 80.18 | 29.439 | ... | 63.496 | 78.553 | 39.322 | 27.733 | 50.244 | 77.382 | 56.9 | 1.29 | 10.247 | 22.899 |
| VACCINES_USED | Beijing CNBG - BBIBP-CorV,Janssen - Ad26.COV 2... | AstraZeneca - Vaxzevria,Gamaleya - Gam-Covid-V... | Beijing CNBG - BBIBP-CorV,Gamaleya - Gam-Covid... | Janssen - Ad26.COV 2-S,Moderna - Spikevax,Pfiz... | AstraZeneca - Vaxzevria,Moderna - Spikevax,Pfi... | SII - Covishield | AstraZeneca - Vaxzevria,Pfizer BioNTech - Comi... | AstraZeneca - Vaxzevria,Beijing CNBG - BBIBP-C... | AstraZeneca - Vaxzevria,Beijing CNBG - BBIBP-C... | AstraZeneca - Vaxzevria,Beijing CNBG - BBIBP-C... | ... | Janssen - Ad26.COV 2-S,Moderna - Spikevax,Pfiz... | AstraZeneca - Vaxzevria,Pfizer BioNTech - Comi... | Anhui ZL - Recombinant,Gamaleya - Gam-Covid-Va... | AstraZeneca - Vaxzevria,Beijing CNBG - BBIBP-C... | Beijing CNBG - BBIBP-CorV,CIGB - CIGB-66,Finla... | AstraZeneca - Vaxzevria,Beijing CNBG - BBIBP-C... | Moderna - Spikevax | Janssen - Ad26.COV 2-S,SII - Covishield,Sinova... | Beijing CNBG - BBIBP-CorV,Janssen - Ad26.COV 2... | Beijing CNBG - BBIBP-CorV,Bharat - Covaxin,Gam... |
| FIRST_VACCINE_DATE | 2021-02-22 | 2021-01-13 | 2021-01-30 | 2020-12-21 | 2021-01-20 | 2021-03-10 | 2021-02-05 | 2021-03-01 | 2020-12-29 | 2021-06-16 | ... | 2020-12-14 | 2021-02-27 | 2021-04-28 | 2021-06-02 | 2021-02-22 | 2021-03-08 | 2021-03-19 | 2021-04-20 | 2021-04-14 | 2021-02-18 |
| NUMBER_VACCINES_TYPES_USED | 4.0 | 5.0 | 4.0 | 3.0 | 3.0 | 1.0 | 2.0 | 6.0 | 7.0 | 5.0 | ... | 3.0 | 3.0 | 7.0 | 3.0 | 6.0 | 6.0 | 1.0 | 3.0 | 3.0 | 4.0 |
14 rows × 228 columns
You can use describe() function to have a quick look on DataFrame:
vac.describe()
| TOTAL_VACCINATIONS | PERSONS_VACCINATED_1PLUS_DOSE | TOTAL_VACCINATIONS_PER100 | PERSONS_VACCINATED_1PLUS_DOSE_PER100 | PERSONS_FULLY_VACCINATED | PERSONS_FULLY_VACCINATED_PER100 | NUMBER_VACCINES_TYPES_USED | |
|---|---|---|---|---|---|---|---|
| count | 2.280000e+02 | 2.270000e+02 | 228.000000 | 227.000000 | 2.270000e+02 | 227.000000 | 225.000000 |
| mean | 4.694756e+07 | 2.187060e+07 | 122.156500 | 55.765784 | 1.928435e+07 | 50.121868 | 3.928889 |
| std | 2.442809e+08 | 1.090964e+08 | 71.896713 | 27.044030 | 9.958222e+07 | 26.417687 | 1.928247 |
| min | 7.400000e+01 | 3.700000e+01 | 0.097000 | 0.082000 | 3.700000e+01 | 0.077000 | 1.000000 |
| 25% | 3.534380e+05 | 1.733685e+05 | 62.841000 | 34.350500 | 1.458095e+05 | 29.097500 | 2.000000 |
| 50% | 2.721102e+06 | 1.536112e+06 | 127.515000 | 63.069000 | 1.192155e+06 | 53.974000 | 4.000000 |
| 75% | 1.670141e+07 | 7.843871e+06 | 178.022250 | 77.008000 | 6.861035e+06 | 72.275500 | 5.000000 |
| max | 3.138003e+09 | 1.276556e+09 | 335.811000 | 124.567000 | 1.235633e+09 | 121.448000 | 11.000000 |
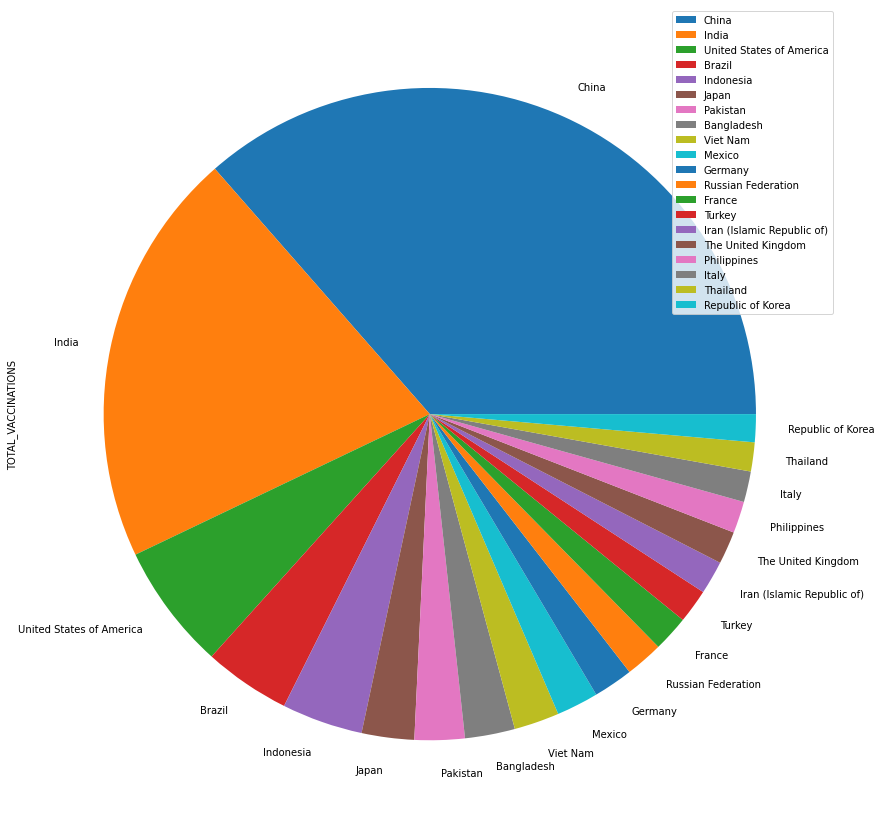
A better way to present data is using plot() function to draw all columns:
import matplotlib.pyplot as plt

vac = vac.sort_values(by='TOTAL_VACCINATIONS', ascending=False)
top20 = vac[['TOTAL_VACCINATIONS']][:20]
countries = vac['COUNTRY'][:20]
top20.index = countries

top20.plot.pie(y='TOTAL_VACCINATIONS', figsize=(15,15))
<AxesSubplot:ylabel='TOTAL_VACCINATIONS'>
Tip
plot() is a convinient way to visualize data in pandas, but it is
not perfect. We will learn more about the data visualization in following lectures.
Select
Pandas provides different ways to select elements in the DataFrame.
iloc
iloc[n] will give the \(n-1\) rows of the DataFrame, i.e., a Series.
vac.iloc[0]
COUNTRY                                                                             China
ISO3                                                                                  CHN
WHO_REGION                                                                           WPRO
DATA_SOURCE                                                                     REPORTING
DATE_UPDATED                                                                   2022-02-27
TOTAL_VACCINATIONS                                                             3138003103
PERSONS_VACCINATED_1PLUS_DOSE                                                1276556393.0
TOTAL_VACCINATIONS_PER100                                                         213.283
PERSONS_VACCINATED_1PLUS_DOSE_PER100                                               86.765
PERSONS_FULLY_VACCINATED                                                     1235633241.0
PERSONS_FULLY_VACCINATED_PER100                                                    83.983
VACCINES_USED                           Anhui ZL - Recombinant,Beijing CNBG - BBIBP-Co...
FIRST_VACCINE_DATE                                                             2020-07-22
NUMBER_VACCINES_TYPES_USED                                                            8.0
Name: 43, dtype: object
Tip
iloc index starts from \(0\), instead of \(1\). So the \(n\)-rows has a index \(n-1\).
In order to select multiple rows, just feed a list containing indices to the iloc:
vac.iloc[[0, 1, 2]]
| COUNTRY | ISO3 | WHO_REGION | DATA_SOURCE | DATE_UPDATED | TOTAL_VACCINATIONS | PERSONS_VACCINATED_1PLUS_DOSE | TOTAL_VACCINATIONS_PER100 | PERSONS_VACCINATED_1PLUS_DOSE_PER100 | PERSONS_FULLY_VACCINATED | PERSONS_FULLY_VACCINATED_PER100 | VACCINES_USED | FIRST_VACCINE_DATE | NUMBER_VACCINES_TYPES_USED | |
|---|---|---|---|---|---|---|---|---|---|---|---|---|---|---|
| 43 | China | CHN | WPRO | REPORTING | 2022-02-27 | 3138003103 | 1.276556e+09 | 213.283 | 86.765 | 1.235633e+09 | 83.983 | Anhui ZL - Recombinant,Beijing CNBG - BBIBP-Co... | 2020-07-22 | 8.0 |
| 94 | India | IND | SEARO | REPORTING | 2022-02-28 | 1776718549 | 9.642345e+08 | 128.747 | 69.872 | 7.923996e+08 | 57.420 | Bharat - Covaxin,Gamaleya - Gam-Covid-Vac,Jans... | 2021-01-16 | 6.0 |
| 218 | United States of America | USA | AMRO | REPORTING | 2022-02-25 | 537567013 | 2.531571e+08 | 162.406 | 76.482 | 2.101726e+08 | 63.496 | Janssen - Ad26.COV 2-S,Moderna - Spikevax,Pfiz... | 2020-12-14 | 3.0 |
Also, you can select both rows and columns at the same time:
vac.iloc[[0, 1, 2], [0, 4, 5]]
| COUNTRY | DATE_UPDATED | TOTAL_VACCINATIONS | |
|---|---|---|---|
| 43 | China | 2022-02-27 | 3138003103 |
| 94 | India | 2022-02-28 | 1776718549 |
| 218 | United States of America | 2022-02-25 | 537567013 |
Or just access single element:
vac.iloc[0, 4]
'2022-02-27'
See also
You can also use slice operations to access elements, try vac.iloc[0:2, 0:3]
loc
As you can see, iloc may be confused to read because it uses numbers as index. However,
loc provides another way to access by index and columns in DataFrame.
vac.loc[0:3, ["COUNTRY", "DATE_UPDATED", "TOTAL_VACCINATIONS"]]
| COUNTRY | DATE_UPDATED | TOTAL_VACCINATIONS | |
|---|---|---|---|
| 0 | Afghanistan | 2022-03-06 | 5597130 |
| 134 | Mongolia | 2022-02-25 | 5568712 |
| 114 | Lebanon | 2022-02-28 | 5452304 |
| 50 | Croatia | 2022-02-20 | 5179921 |
| 87 | Guinea | 2022-03-03 | 5159979 |
| ... | ... | ... | ... |
| 151 | Northern Mariana Islands (Commonwealth of the) | 2022-02-04 | 105295 |
| 68 | Faroe Islands | 2022-02-18 | 103894 |
| 132 | Micronesia (Federated States of) | 2022-02-16 | 97185 |
| 82 | Grenada | 2022-02-25 | 85891 |
| 3 | American Samoa | 2022-02-16 | 85050 |
103 rows × 3 columns
Important
Becareful with the index names in iloc and loc. They are different.
Filter
Both loc and iloc accept boolean parameters, which can be used to filter
particular elements in the DataFrame.
vac[vac['TOTAL_VACCINATIONS'] > 100000000]
| COUNTRY | ISO3 | WHO_REGION | DATA_SOURCE | DATE_UPDATED | TOTAL_VACCINATIONS | PERSONS_VACCINATED_1PLUS_DOSE | TOTAL_VACCINATIONS_PER100 | PERSONS_VACCINATED_1PLUS_DOSE_PER100 | PERSONS_FULLY_VACCINATED | PERSONS_FULLY_VACCINATED_PER100 | VACCINES_USED | FIRST_VACCINE_DATE | NUMBER_VACCINES_TYPES_USED | |
|---|---|---|---|---|---|---|---|---|---|---|---|---|---|---|
| 43 | China | CHN | WPRO | REPORTING | 2022-02-27 | 3138003103 | 1.276556e+09 | 213.283 | 86.765 | 1.235633e+09 | 83.983 | Anhui ZL - Recombinant,Beijing CNBG - BBIBP-Co... | 2020-07-22 | 8.0 |
| 94 | India | IND | SEARO | REPORTING | 2022-02-28 | 1776718549 | 9.642345e+08 | 128.747 | 69.872 | 7.923996e+08 | 57.420 | Bharat - Covaxin,Gamaleya - Gam-Covid-Vac,Jans... | 2021-01-16 | 6.0 |
| 218 | United States of America | USA | AMRO | REPORTING | 2022-02-25 | 537567013 | 2.531571e+08 | 162.406 | 76.482 | 2.101726e+08 | 63.496 | Janssen - Ad26.COV 2-S,Moderna - Spikevax,Pfiz... | 2020-12-14 | 3.0 |
| 29 | Brazil | BRA | AMRO | REPORTING | 2022-02-25 | 369527744 | 1.723341e+08 | 173.847 | 81.076 | 1.487775e+08 | 69.993 | AstraZeneca - Vaxzevria,Janssen - Ad26.COV 2-S... | 2021-01-17 | 5.0 |
| 95 | Indonesia | IDN | SEARO | REPORTING | 2022-03-01 | 345697245 | 1.909768e+08 | 126.387 | 69.821 | 1.445058e+08 | 52.831 | AstraZeneca - Vaxzevria,Beijing CNBG - BBIBP-C... | 2021-01-13 | 7.0 |
| 103 | Japan | JPN | WPRO | REPORTING | 2022-02-24 | 223820819 | 1.016722e+08 | 176.966 | 80.388 | 1.001786e+08 | 79.207 | AstraZeneca - Vaxzevria,Moderna - Spikevax,Nov... | 2021-02-17 | 4.0 |
| 155 | Pakistan | PAK | EMRO | REPORTING | 2022-02-28 | 213532343 | 1.243097e+08 | 96.668 | 56.276 | 1.000965e+08 | 45.315 | Beijing CNBG - BBIBP-CorV,Bharat - Covaxin,Can... | 2021-02-03 | 8.0 |
| 16 | Bangladesh | BGD | SEARO | REPORTING | 2022-03-01 | 213176935 | 1.246919e+08 | 129.442 | 75.713 | 8.461175e+07 | 51.377 | AstraZeneca - Vaxzevria,Beijing CNBG - BBIBP-C... | 2021-01-27 | 8.0 |
| 223 | Viet Nam | VNM | WPRO | REPORTING | 2022-02-24 | 192865986 | 7.946939e+07 | 198.139 | 81.642 | 7.532254e+07 | 77.382 | AstraZeneca - Vaxzevria,Beijing CNBG - BBIBP-C... | 2021-03-08 | 6.0 |
| 131 | Mexico | MEX | AMRO | REPORTING | 2022-02-25 | 179274307 | 8.508365e+07 | 139.045 | 65.991 | 7.875005e+07 | 61.078 | AstraZeneca - Vaxzevria,CanSino - Convidecia,G... | 2020-12-24 | 7.0 |
| 77 | Germany | DEU | EURO | REPORTING | 2022-02-20 | 169071638 | 6.338051e+07 | 203.300 | 76.209 | 6.250088e+07 | 75.151 | AstraZeneca - Vaxzevria,Janssen - Ad26.COV 2-S... | 2020-12-23 | 4.0 |
| 170 | Russian Federation | RUS | EURO | OWID | 2022-02-17 | 160816996 | 7.828428e+07 | 110.200 | 53.643 | 7.160191e+07 | 49.064 | SRCVB - EpiVacCorona, Gamaleya - Sputnik V | NaN | 2.0 |
| 71 | France | FRA | EURO | REPORTING | 2022-02-20 | 153013512 | 5.470059e+07 | 227.300 | 81.254 | 5.368728e+07 | 79.749 | AstraZeneca - Vaxzevria,Janssen - Ad26.COV 2-S... | 2020-12-30 | 4.0 |
| 210 | Turkey | TUR | EURO | OWID | 2022-02-23 | 144850157 | 5.762345e+07 | 171.700 | 69.296 | 5.271558e+07 | 63.394 | Pfizer BioNTech - Comirnaty, Sinovac - CoronaV... | NaN | 3.0 |
| 96 | Iran (Islamic Republic of) | IRN | EMRO | REPORTING | 2022-03-06 | 142195819 | 6.311054e+07 | 169.295 | 75.138 | 5.571737e+07 | 66.336 | AstraZeneca - Vaxzevria,Beijing CNBG - BBIBP-C... | 2021-02-09 | 6.0 |
| 203 | The United Kingdom | GBR | EURO | REPORTING | 2022-02-22 | 139482283 | 5.257359e+07 | 205.500 | 77.246 | 4.888589e+07 | 71.828 | AstraZeneca - Vaxzevria,Moderna - Spikevax,Pfi... | 2020-12-21 | 3.0 |
| 161 | Philippines | PHL | WPRO | REPORTING | 2022-02-24 | 135251295 | 6.866160e+07 | 123.426 | 62.658 | 6.301683e+07 | 57.507 | AstraZeneca - Vaxzevria,Beijing CNBG - BBIBP-C... | 2021-03-01 | 11.0 |
| 101 | Italy | ITA | EURO | REPORTING | 2022-02-20 | 131126289 | 5.019838e+07 | 219.900 | 84.171 | 4.679558e+07 | 78.461 | AstraZeneca - Vaxzevria,Janssen - Ad26.COV 2-S... | 2020-12-23 | 4.0 |
| 202 | Thailand | THA | SEARO | REPORTING | 2022-02-28 | 123738218 | 5.358496e+07 | 177.275 | 76.769 | 4.967325e+07 | 71.165 | AstraZeneca - Vaxzevria,Beijing CNBG - BBIBP-C... | 2021-02-28 | 7.0 |
| 167 | Republic of Korea | KOR | WPRO | REPORTING | 2022-02-27 | 118895241 | 4.477671e+07 | 231.904 | 87.336 | 4.428542e+07 | 86.378 | AstraZeneca - Vaxzevria,Janssen - Ad26.COV 2-S... | 2021-02-26 | 5.0 |